Graph checklist;
- have you selected the right type of graph to plot? (bar graph or line graph)
- does your graph have a title
- are both axis labeled
- do axis have a unit (m, kg, cm, s) if they are a measurement
- is all data plotted correctly
- is the line of best fit a straight line or a curve for your line graph?
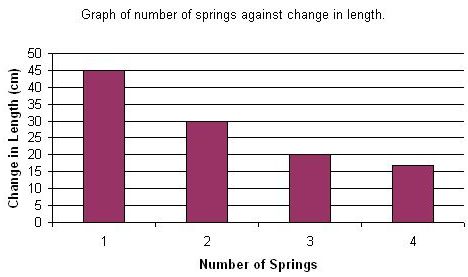
Bar Graph
If one of the variables you are plotting is not a continuous variable you should plot a bar graph.

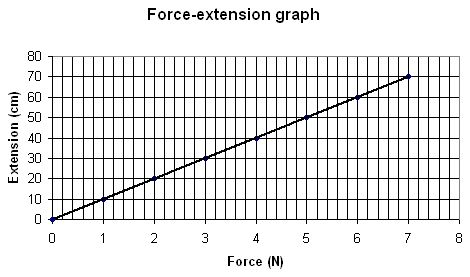
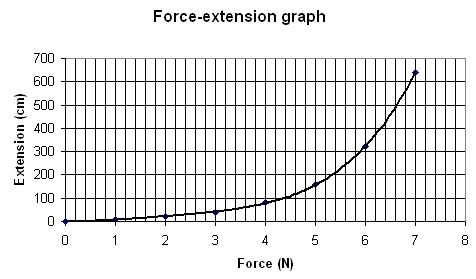
Line graph
If you are plotting two sets of continuous variables you should plot a line graph.
- if the plotted points look like a straight line draw one straight line with a ruler to show the overall pattern in your data.
- if the plotted points look like a curve draw a free hand smooth curve (DO NOT USE A RULER).


